Follow Us :

Generic selectors
Exact matches only
Search in title
Search in content
Post Type Selectors
page

Courses

Generic selectors
Exact matches only
Search in title
Search in content
Post Type Selectors
page

Power BI for Marketing Analytics: Create a Campaign Performance Dashboard

Power BI for Marketing Analytics: Create a Campaign Performance Dashboard

Marketers live in a world of data overload. Newsletters and email updates, social media channels, paid advertisements, and web analytic tools all, contend for attention – offering their dashboards and reports. With all the data disbursed across so many sources, it can be easy to waste time and get lost in campaign performance. Enter Power BI marketing analytics. Power BI changes all that by linking platforms and integrating your data into one holistic view. You can now quickly identify trends, respond quickly, and make an informed decision. Marketers have more time to formulate strategies and grow their business, rather than struggling with spreadsheets and manual reports, while Power BI for marketing data visualization does the heavy data lifting.

The comprehensive methodology and advanced techniques covered in this blog are taught in-depth at DG Training’s KHDA-approved Power BI course in Dubai. Our hands-on program equips professionals with practical skills in marketing analytics in Power BI, enabling them to transform raw campaign data into actionable business insights that drive measurable growth.

TL;DR - Quick Summary

This blog explores how Power BI for campaign performance analysis empowers marketers to seamlessly bring together and visualize data from platforms like Google Ads, Facebook, and HubSpot. Learn how unified Power BI marketing dashboards deliver real campaign clarity, highlighting what’s working and where your marketing budget will have the biggest impact. Additionally, discover complete hands-on modules in advanced data modeling, DAX calculations, and automated report generation – core components of our comprehensive training program at DG Training Dubai.

Why Power BI Excels for Marketing Analytics

This tool can connect to a variety of data sources and handle complex datasets, all while delivering clear, impactful visualizations. The traditional spreadsheet approach struggles with multi-platform data collection. For this other CMOs are using Power BI for their needs in marketing data visualization.

The platform is powered to connect with several commonly used marketing tools like the Google Ads, Facebook Business Manager and Hubspot. Microsoft Power BI offers the ability to connect with Google Analytics for real-time data synchronization, so your dashboard will update whenever the campaign is running and avoid manual data exports to produce a more reliable report.

Modern marketers need insights, not just data. Unprocessed data can be quickly turned into visual narratives that show patterns, opportunities, and warning indicators with Power BI marketing dashboard capabilities.

Essential Campaign Performance Metrics

Choosing the appropriate metrics is the first step in creating Power BI conversion tracking dashboards that work. Every campaign performance dashboard should monitor the following key performance indicators:

Metric Category

Key Metrics

Why It Matters

Traffic & Reach

Impressions, Clicks, Reach

Shows campaign visibility and initial engagement

Conversion Metrics

Conversion Rate, Cost per Conversion, Lead Quality Score

Measures campaign effectiveness

Financial Performance

ROI, ROAS, Cost per Acquisition (CPA)

Tracks profitability and budget efficiency

Engagement Quality

Click-through Rate, Time on Site, Bounce Rate

Indicates audience relevance and content quality

Step-by-Step Dashboard Creation Process

Connect Your Data Sources

Connect Power BI marketing analytics to your marketing platforms first. The platform provides native connectors for popular analytics and advertising platforms.

Choose your marketing platforms by navigating to “Get Data.” Integrating Google Analytics, Facebook Ads, and Google Ads is simple and not reliant on complex APIs. Use Power BI’s specific connectors from email marketing analytics platforms like Constant Contact or Mailchimp.

Pro tip: First, establish distinct data connections for every platform. This method preserves data integrity while streamlining troubleshooting – a technique emphasized in our KHDA-certified program at DG Training Dubai.

Design Your Dashboard Layout

The visual hierarchy of an effective Microsoft Power BI marketing dashboard makes sense. Put your most important metrics in the center. Detailed breakdowns and secondary metrics are better suited for supporting roles.

Examine this tried-and-true layout design:

  • Top Section: High-level KPI cards that display current month performance in relation to objectives, total spend, total conversions, and overall ROI.
  • Middle Section: Channel-specific metrics, performance trends over time, and campaign comparison charts.
  • Bottom Section: Comprehensive tables containing Power BI audience segmentation analysis, campaign data, and fine-grained performance breakdowns.

Build Key Visualizations

For your Power BI for campaign performance analysis dashboard to effectively convey marketing data, certain chart types are required:

KPI Cards are ideal for headline figures like total conversions, current ROI, and monthly budget utilization. These offer real-time performance snapshots.

Line charts are excellent for displaying performance trends over time in your Power BI marketing ROI report. Monitor return on ad spend, cost per acquisition, and conversion rates over the course of several weeks or months.

Column charts are used to compare the performance of various marketing channels, ad groups, or campaigns. They facilitate the identification of high and low performers.

Budget distribution across channels or campaign types is effectively displayed by donut charts. They offer instantaneous visual proportions.

Advanced Analytics Features

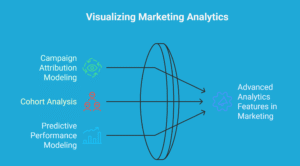
Campaign Attribution Modeling

Advanced attribution analysis is supported by Microsoft Power BI marketing analytics. To comprehend the entire customer journey, go beyond last-click attribution.

Make calculated metrics that assign a weight to touchpoints according to where they are in the conversion path. Awareness drivers are revealed by first-click attribution. Multi-touch attribution displays the contribution of the entire campaign ecosystem.

Cohort Analysis Integration

Monitor the performance of various customer acquisition cohorts over time with Power BI audience segmentation analysis. This analysis shows whether campaign quality rather than just volume improves month over month.

Create cohort tables to track the evolution of a customer’s lifetime value by grouping them by acquisition month. Budget allocation and long-term campaign strategy are guided by this insight.

Predictive Performance Modeling

Based on past trends, Power BI for marketing data visualization AI capabilities can predict campaign performance. To predict the likely performance for the upcoming month, activate the forecast features on your trend charts.

These forecasts aid in goal-setting and budget planning. Additionally, they indicate when present performance trends will fall short of goals, allowing for proactive campaign modifications.

For those aiming to build a career in analytics, mastering Power BI is essential — check out this guide on how to become a data analyst in 2025 to see the skills and pathways you need.

Mood and Emotion Prompts

These AI image prompts capture specific feelings or atmospheres in your visuals. They work excellently for brand storytelling and emotional marketing.

Example for Blog Content:

Create an image where A group of imaginative children dressed as tiny chefs joyfully mess around with icing and sprinkles, somehow ending up crafting a playful cake that transforms into our logo — the mood is full of innocence, wonder, and surprise.

Campaign Performance Dashboard Template

Here’s a practical template structure for your Power BI marketing dashboard:

Dashboard Section

Visualizations

Key Metrics

Executive Summary

4 KPI Cards, 1 Gauge Chart

Total ROI, Monthly Budget Usage, Conversion Count, Average CPA

Trend Analysis

3 Line Charts

Daily conversions, Weekly spend, Monthly ROI trends

Channel Comparison

2 Column Charts, 1 Matrix Table

Channel performance, Campaign rankings, Detailed metrics

Audience Insights

2 Donut Charts, 1 Map Visual

Demographics breakdown, Geographic performance, Device usage

Data Refresh and Automation

Marketing campaigns are fast-paced. For your Power BI conversion tracking dashboard to facilitate real-time decision-making, new data is required.

Schedule automatic data refreshes according to the urgency of your campaigns. Most campaigns benefit from daily refreshes, but high-spend projects might require hourly updates.

Configure data alerts for important metrics in your Power BI marketing ROI report. Stakeholders are promptly notified when conversion rates fall below predetermined levels or expenses surpass allocated funds. This proactive strategy keeps minor problems from turning into costly ones.

Your marketing team will always have access to performance data thanks to Power BI integrated with Google Analytics mobile apps. During travel or off-peak hours, quick campaign adjustments are made possible by critical alerts and smartphone dashboard access.

Common Implementation Challenges

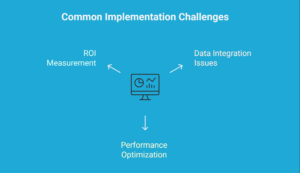
Data Integration Issues

Different metric definitions and naming conventions are frequently used by marketing platforms. The difference between Facebook’s “purchase events” and Google Ads “conversions” is how they are measured.

In order to standardize metrics between marketing analytics platforms (for use in Power BI), you will need to create standardized calculated columns. To ensure that team members are aware of what each dashboard metric means, clearly document these definitions.

Performance Optimization

Dashboard performance may be slowed by large marketing datasets. Put these optimization techniques into practice:

Instead of loading individual event records, pre-aggregate daily metrics using data summarization. This method significantly reduces load times without sacrificing accuracy in your Power BI for campaign performance analysis.

For real-time requirements, take into account DirectQuery connections rather than Import mode for improved historical analysis performance.

When feasible, apply filters at the level of the data source. Unnecessary data transfer is decreased by loading only pertinent date ranges and campaign types.

ROI Measurement and Success Tracking

The business impact of marketing should be evident in your Power BI marketing analytics dashboard. Make specific sections that convert campaign data into financial results.

Create calculating metrics that link marketing expenditure to closed revenue and pipeline generation in your Power BI marketing ROI report. This link demonstrates how marketing helps businesses expand and supports spending.

Monitor the long-term impacts on customer lifetime value as well as the short-term ROAS with Power BI audience segmentation analysis. While some campaigns create brand awareness that converts over months, others yield results right away.

Conclusion

The revolution of Marketing analytics in Power BI has changed the way marketing teams have visibility into the subsequent performance of campaign media. By applying the integration of data from multiple platforms into a unified marketing dashboard in Power BI, marketers are able to obtain the necessary insights for optimal outcomes.

The methodical process described here offers a tried-and-true structure for creating thorough Power BI for campaign performance analysis dashboards. Every component helps make better marketing decisions, from the first data connections to the more sophisticated analytics tools.

Keep in mind that successful dashboards change as your campaigns and business requirements do. As your team grows more accustomed to the platform, add more features after starting with the essential metrics and visualizations.

The solutions to improved campaign performance are in your marketing data. With Power BI for the visualization of marketing data, you have the tools to derive those insights and proceed with confidence.

Ready to Change Your Marketing Analytics?

Don’t keep important campaign data in silos. With Power BI marketing analytics, you can combine, examine, and act on your performance data – all in one place.

Convert scattered marketing data into powerful insights that drive real business growth. Your data holds the secret to your next big campaign breakthrough.

Take the next step – master Power BI with our KHDA-certified course in Dubai.

Understanding the value of KHDA certification can help you make informed career decisions in Dubai’s competitive job market.

Why Choose DG Training Dubai?

  • KHDA-Approved Certification: Accepted Across GCC, Saudi Arabia, Qatar and UAE
  • Expert Faculty: Learn from professionals with decades of consulting in Marketing Analytics
  • Hands-on Training: Work on real business cases in finance, retail and logistics.
  • Flexible Learning Options: Choose from online or offline modes in Barsha Heights
  • Practical Skills: Master advanced DAX, data modeling, and automated reporting
  • Job Assistance: Career support and placement guidance
  • Lifetime Access: Continuous learning support even after course completion.


Transform your career in marketing analytics with Microsoft Power BI. Our comprehensive program covers everything from building basic marketing dashboards to mastering advanced audience segmentation and integrating with Google Analytics. Explore our KHDA-certified Power BI course at DG Training Dubai and empower your career with practical, data-driven marketing skills. 

FAQs

How often should the data in my Power BI marketing dashboard be refreshed?

Most marketing campaigns would see great value being refreshed daily. If the campaign has a time-sensitive service or a higher spend (more critical campaign), then updating this hourly may be beneficial in flowing with the quickly changing environment. The data freshness versus system performance; always meeting gateway limits should also be at a focus in decision making.

Can Power BI connect directly to Facebook and Google Ads?

Native connectors for both platforms are available in Power BI marketing analytics. Direct connections can be made without complicated API setup. Your current platform credentials are used for authentication.

What distinguishes the DirectQuery and Import modes for marketing data?

Import mode requires scheduled refreshes but loads data into Power BI for faster performance. While large datasets can sometimes slow down DirectQuery functionality, it provides up-to-date reports as it connects to a data source.

How do I manage multiple attribution models across different marketing platforms?

Develop calculated metrics that are standardized and use the same attribution logic on all platforms in your Power BI conversion tracking dashboard. To guarantee accurate cross-platform comparisons, record your selected attribution strategy and use it consistently.

Is it possible to automate alerts for problems with campaign performance?

Data alerts for important metrics are supported by Power BI marketing ROI reports. Set up threshold-based alerts that can trigger when significant metrics are out of expected ranges, conversion rates decline, or if spending exceeds the planned budget.

How do I determine the way to share marketing dashboards?

Provide suitable access levels by utilizing Power BI for marketing data visualization sharing features. Executive stakeholders typically require view-only access to summary dashboards, whereas someone like a campaign manager will need editing rights to analyse them in-depth.

Published: August 16, 2025

Last updated: August 16, 2025

Enroll into our Courses

Dr. Shahryar Banan for Digi Training

Dr. Shahryar Banan

Dr. Shahryar Banan is an eminent English educator based in Dubai, renowned for his extensive expertise. With a PhD in TEFL and 14 years of teaching experience, he excels in instructing English as a foreign language and crafting dynamic course curricula, including specialized offerings like Business English. As a sought-after IELTS and PTE instructor, Dr. Banan has guided numerous students to success in language proficiency exams. He holds a prestigious Cambridge

CELTA certificate and contributes to language assessment as a Cambridge OET interlocutor. His dedication to language education in Dubai has established him as a trusted authority, empowering learners with invaluable language skills.

Search

Categories

Latest Posts

Generic selectors
Exact matches only
Search in title
Search in content
Post Type Selectors
page

Enquire Now

As CEO of Digi Institution, it is a privilege and an honor to speak for you and convey my most sincere thanks for your involvement in our educational institution. Digi Institution’s purpose is to be a learning lighthouse, delivering a comprehensive selection of courses that will help individuals cultivate their professional as well as personal interests.

I am a firm believer that education is the foundation of personal success and development. The key opens doors to new possibilities, broadens perceptions, and ignites desire. Our educational institution is committed to cultivating this study culture and ensuring that every student who walks through our doors has an exceptional educational experience.

We have confidence in our distinguished teaching staff who are specialists in their professions and passionate about passing on their knowledge to our students. They serve as dedicated coaches who go above and above to offer advice, support, and inspiration. Our faculty members are constantly looking for new ways to teach, ensuring that our courses stay dynamic and relevant to the shifting requirements of businesses and society.

At Digi Institution, we understand that education involves more than just four walls. Our goal is to create an enjoyable and fascinating place to work that encourages innovative thinking, critical thinking, and teamwork. Learners are inspired to explore their hobbies, challenge their limits, and achieve their full potential with bright class discussions, linking projects, and extracurricular activities.

It is essential to be flexible and nimble in the modern age. In addition to business and management, we offer programs in technology, the arts and humanities, and health sciences. Our constant goal is to adjust our ways to match the changing labor market needs and to increase our students’ abilities to thrive in their chosen fields.

Furthermore, we think that learning constitutes an ongoing process. The commitment we make for our students does not end with graduation. Our mission is to create in them a lifelong love of studying and a quest for knowledge. Through possibilities for professional progression, skill refinement, and promotion, our training and development programs ensure that our students remain at the cutting-edge of their industry.